Analytics Debug Panel
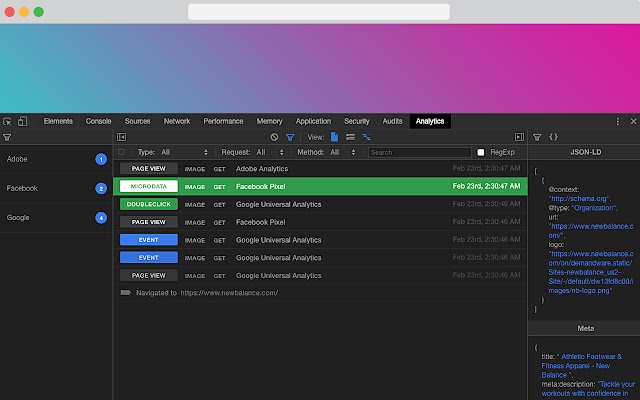
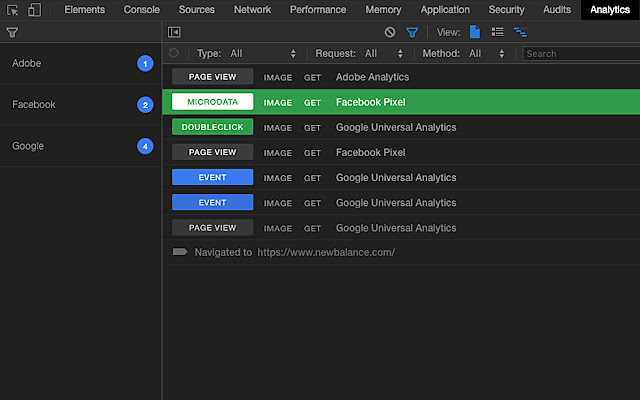
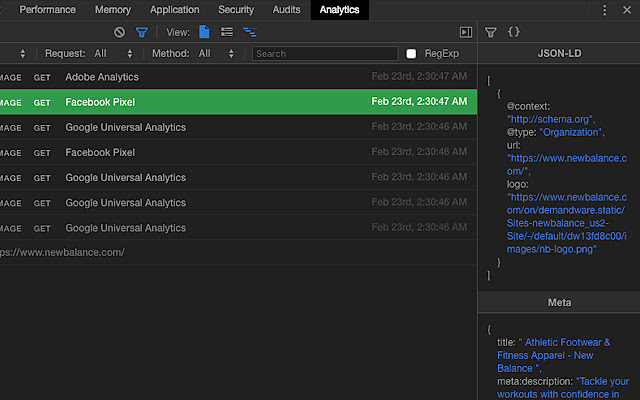
Analytics Debug Panel is an Open Source browser extension to inspect, search & filter analytics traffic in your Developer Console.
ما هو Analytics Debug Panel؟
Analytics Debug Panel هو إضافة Chrome تم تطويرها بواسطة https://redvanworkshop.com، والميزة الرئيسية لها هي "Analytics Debug Panel is an Open Source browser extension to inspect, search & filter analytics traffic in your Developer Console.".
لقطات شاشة التمديد

تحميل ملف CRX للإضافة Analytics Debug Panel
قم بتنزيل ملفات الامتداد Analytics Debug Panel بتنسيق crx ، وقم بتثبيت الامتدادات يدويًا في متصفح Chrome ، أو شارك ملفات crx مع الأصدقاء لتثبيت الامتدادات بسهولة.
تعليمات استخدام التمديد
                        Red Van Workshop works with online retailers that have a variety of Analytic Providers for their differing business needs.  Working on new integrations and debugging existing ones is an integral part of our developer process.  We built this Browser Extension to help make that process easier.  We hope you will find it as useful as we do, and if you want to help make it better, we'd love to hear from you.

FEATURES:

• 100% Open Source
• Support for Chrome, Firefox & Opera
• Works with Adobe, Google & Facebook Analytics
• Copy Requests to Clipboard
• Light & Dark Themes
معلومات أساسية عن التمديد
| الاسم |  Analytics Debug Panel Analytics Debug Panel |
| ID | poaajdjaghjhnampllfkclmepngmaekb |
| عنوان URL الرسمي | https://chrome.google.com/webstore/detail/analytics-debug-panel/poaajdjaghjhnampllfkclmepngmaekb |
| الوصف | Analytics Debug Panel is an Open Source browser extension to inspect, search & filter analytics traffic in your Developer Console. |
| حجم الملف | 710 KB |
| عدد التثبيتات | 139 |
| النسخة الحالية | 1.0.0 |
| آخر تحديث | 2019-02-28 |
| تاريخ النشر | 2019-02-23 |
| تقييم | 5.00/5 مجموع تقييمات 1 |
| المطور | https://redvanworkshop.com |
| البريد الإلكتروني | [email protected] |
| نوع الدفع | free |
| موقع الإضافة | https://github.com/redvanworkshop/analytics-debug-panel |
| عنوان صفحة المساعدة | https://github.com/redvanworkshop/analytics-debug-panel/issues |
| اللغات المدعومة | en |
| manifest.json | |
{
    "update_url": "https:\/\/clients2.google.com\/service\/update2\/crx",
    "name": "Analytics Debug Panel",
    "version": "1.0.0",
    "description": "Analytics Debug Panel is an Open Source browser extension to inspect, search & filter analytics traffic in your Developer Console.",
    "author": "Peter Schmalfeldt",
    "manifest_version": 2,
    "icons": {
        "16": "icons\/16.png",
        "48": "icons\/48.png",
        "128": "icons\/128.png"
    },
    "permissions": [
        "http:\/\/*\/*",
        "https:\/\/*\/*",
        "storage",
        "tabs",
        "webNavigation",
        "webRequest",
        "webRequestBlocking"
    ],
    "browser_action": {
        "default_icon": "icons\/128.png",
        "default_title": "Analytics Debugger"
    },
    "background": {
        "page": "pages\/background.html"
    },
    "devtools_page": "pages\/devtools.html",
    "content_security_policy": "script-src 'self' 'unsafe-eval'; object-src 'self'",
    "web_accessible_resources": [
        "panel.html",
        "js\/vendor.js",
        "js\/manifest.js",
        "js\/browser-polyfill.js"
    ]
} | |