Analytics Debug Panel
Analytics Debug Panel is an Open Source browser extension to inspect, search & filter analytics traffic in your Developer Console.
Apa itu Analytics Debug Panel?
Analytics Debug Panel adalah ekstensi Chrome yang dikembangkan oleh https://redvanworkshop.com, dan fitur utamanya adalah "Analytics Debug Panel is an Open Source browser extension to inspect, search & filter analytics traffic in your Developer Console.".
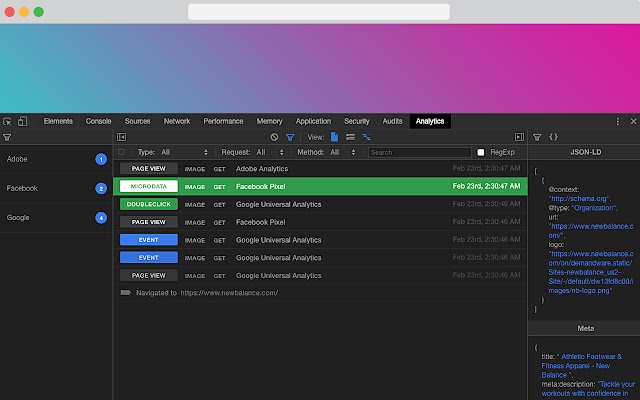
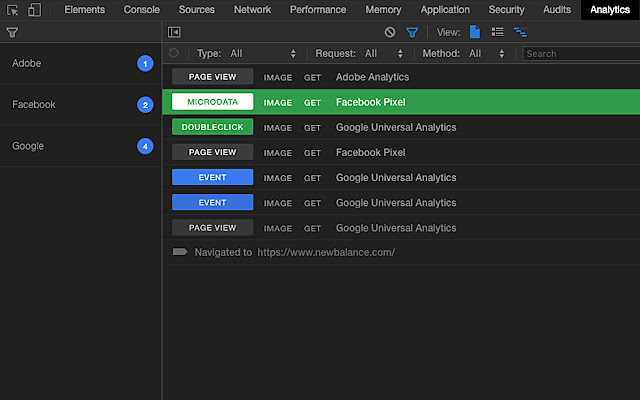
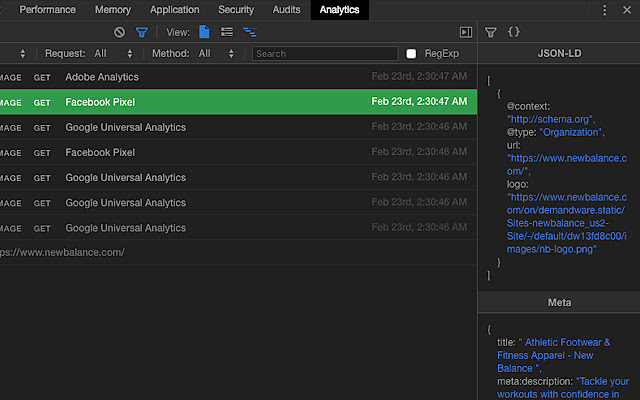
Screenshot Ekstensi

Unduh Berkas CRX Ekstensi Analytics Debug Panel
Unduh file ekstensi Analytics Debug Panel dalam format crx, pasang ekstensi Chrome secara manual di peramban, atau bagikan file crx dengan teman untuk menginstal ekstensi Chrome dengan mudah.
Petunjuk Penggunaan Ekstensi
                        Red Van Workshop works with online retailers that have a variety of Analytic Providers for their differing business needs.  Working on new integrations and debugging existing ones is an integral part of our developer process.  We built this Browser Extension to help make that process easier.  We hope you will find it as useful as we do, and if you want to help make it better, we'd love to hear from you.

FEATURES:

• 100% Open Source
• Support for Chrome, Firefox & Opera
• Works with Adobe, Google & Facebook Analytics
• Copy Requests to Clipboard
• Light & Dark Themes
Informasi Dasar Ekstensi
| Nama |  Analytics Debug Panel Analytics Debug Panel |
| ID | poaajdjaghjhnampllfkclmepngmaekb |
| URL Resmi | https://chrome.google.com/webstore/detail/analytics-debug-panel/poaajdjaghjhnampllfkclmepngmaekb |
| Deskripsi | Analytics Debug Panel is an Open Source browser extension to inspect, search & filter analytics traffic in your Developer Console. |
| Ukuran File | 710 KB |
| Jumlah Instalasi | 139 |
| Versi Saat Ini | 1.0.0 |
| Terakhir Diperbarui | 2019-02-28 |
| Tanggal Publikasi | 2019-02-23 |
| Penilaian | 5.00/5 Total 1 Penilaian |
| Pengembang | https://redvanworkshop.com |
| [email protected] | |
| Tipe Pembayaran | free |
| Situs Ekstensi | https://github.com/redvanworkshop/analytics-debug-panel |
| URL Halaman Bantuan | https://github.com/redvanworkshop/analytics-debug-panel/issues |
| Bahasa yang Didukung | en |
| manifest.json | |
{
    "update_url": "https:\/\/clients2.google.com\/service\/update2\/crx",
    "name": "Analytics Debug Panel",
    "version": "1.0.0",
    "description": "Analytics Debug Panel is an Open Source browser extension to inspect, search & filter analytics traffic in your Developer Console.",
    "author": "Peter Schmalfeldt",
    "manifest_version": 2,
    "icons": {
        "16": "icons\/16.png",
        "48": "icons\/48.png",
        "128": "icons\/128.png"
    },
    "permissions": [
        "http:\/\/*\/*",
        "https:\/\/*\/*",
        "storage",
        "tabs",
        "webNavigation",
        "webRequest",
        "webRequestBlocking"
    ],
    "browser_action": {
        "default_icon": "icons\/128.png",
        "default_title": "Analytics Debugger"
    },
    "background": {
        "page": "pages\/background.html"
    },
    "devtools_page": "pages\/devtools.html",
    "content_security_policy": "script-src 'self' 'unsafe-eval'; object-src 'self'",
    "web_accessible_resources": [
        "panel.html",
        "js\/vendor.js",
        "js\/manifest.js",
        "js\/browser-polyfill.js"
    ]
} | |