Analytics Debug Panel
Analytics Debug Panel is an Open Source browser extension to inspect, search & filter analytics traffic in your Developer Console.
Cos'è Analytics Debug Panel?
Analytics Debug Panel è un'estensione di Chrome sviluppata da https://redvanworkshop.com, e la sua funzione principale è "Analytics Debug Panel is an Open Source browser extension to inspect, search & filter analytics traffic in your Developer Console.".
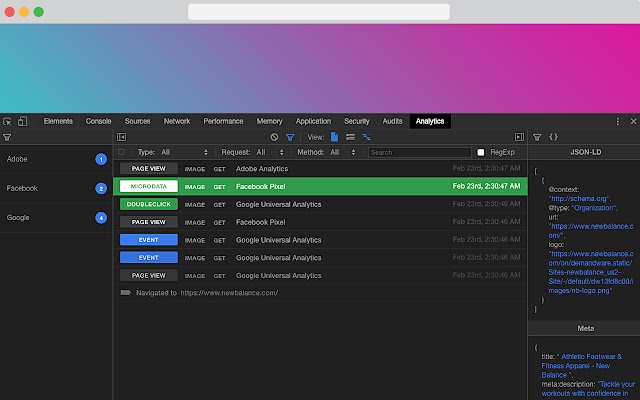
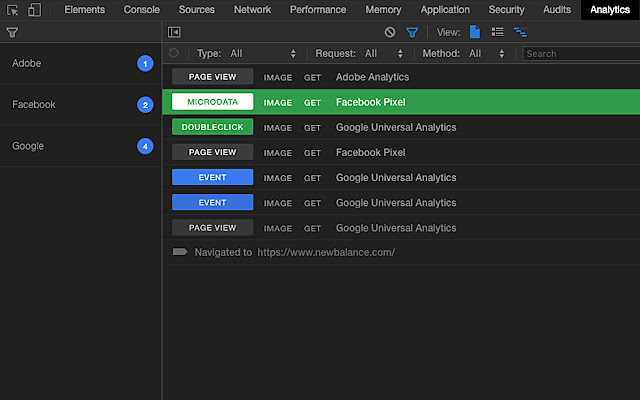
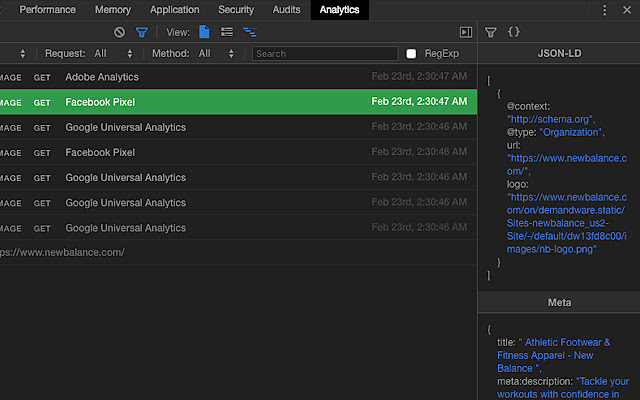
Screenshot dell'Estensione

Scarica il file CRX dell'estensione Analytics Debug Panel
Scarica i file di estensione Analytics Debug Panel in formato crx, installa manualmente le estensioni di Chrome nel browser o condividi i file crx con gli amici per installare facilmente le estensioni di Chrome.
Istruzioni per l'Uso dell'Estensione
                        Red Van Workshop works with online retailers that have a variety of Analytic Providers for their differing business needs.  Working on new integrations and debugging existing ones is an integral part of our developer process.  We built this Browser Extension to help make that process easier.  We hope you will find it as useful as we do, and if you want to help make it better, we'd love to hear from you.

FEATURES:

• 100% Open Source
• Support for Chrome, Firefox & Opera
• Works with Adobe, Google & Facebook Analytics
• Copy Requests to Clipboard
• Light & Dark Themes
Informazioni di Base sull'Estensione
| Nome |  Analytics Debug Panel Analytics Debug Panel |
| ID | poaajdjaghjhnampllfkclmepngmaekb |
| URL Ufficiale | https://chrome.google.com/webstore/detail/analytics-debug-panel/poaajdjaghjhnampllfkclmepngmaekb |
| Descrizione | Analytics Debug Panel is an Open Source browser extension to inspect, search & filter analytics traffic in your Developer Console. |
| Dimensione del File | 710 KB |
| Conteggio Installazioni | 139 |
| Versione Corrente | 1.0.0 |
| Ultimo Aggiornamento | 2019-02-28 |
| Data di Pubblicazione | 2019-02-23 |
| Valutazione | 5.00/5 Totale 1 Valutazioni |
| Sviluppatore | https://redvanworkshop.com |
| [email protected] | |
| Tipo di Pagamento | free |
| Sito Web dell'Estensione | https://github.com/redvanworkshop/analytics-debug-panel |
| URL della Pagina di Aiuto | https://github.com/redvanworkshop/analytics-debug-panel/issues |
| Lingue Supportate | en |
| manifest.json | |
{
    "update_url": "https:\/\/clients2.google.com\/service\/update2\/crx",
    "name": "Analytics Debug Panel",
    "version": "1.0.0",
    "description": "Analytics Debug Panel is an Open Source browser extension to inspect, search & filter analytics traffic in your Developer Console.",
    "author": "Peter Schmalfeldt",
    "manifest_version": 2,
    "icons": {
        "16": "icons\/16.png",
        "48": "icons\/48.png",
        "128": "icons\/128.png"
    },
    "permissions": [
        "http:\/\/*\/*",
        "https:\/\/*\/*",
        "storage",
        "tabs",
        "webNavigation",
        "webRequest",
        "webRequestBlocking"
    ],
    "browser_action": {
        "default_icon": "icons\/128.png",
        "default_title": "Analytics Debugger"
    },
    "background": {
        "page": "pages\/background.html"
    },
    "devtools_page": "pages\/devtools.html",
    "content_security_policy": "script-src 'self' 'unsafe-eval'; object-src 'self'",
    "web_accessible_resources": [
        "panel.html",
        "js\/vendor.js",
        "js\/manifest.js",
        "js\/browser-polyfill.js"
    ]
} | |