Analytics Debug Panel
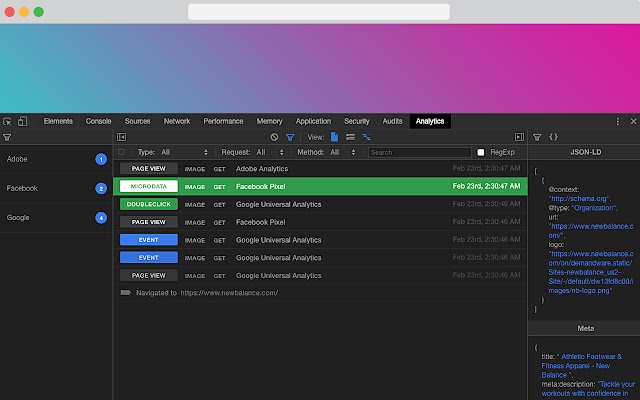
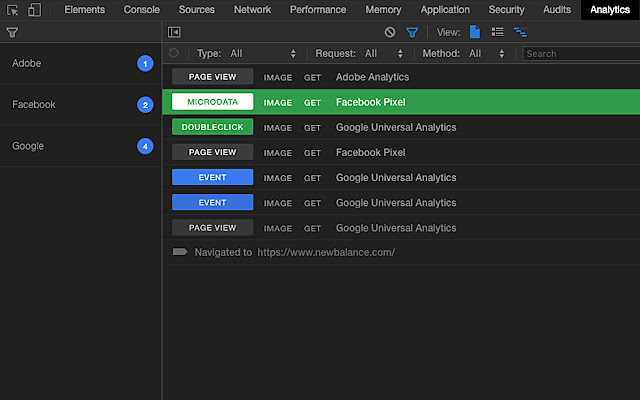
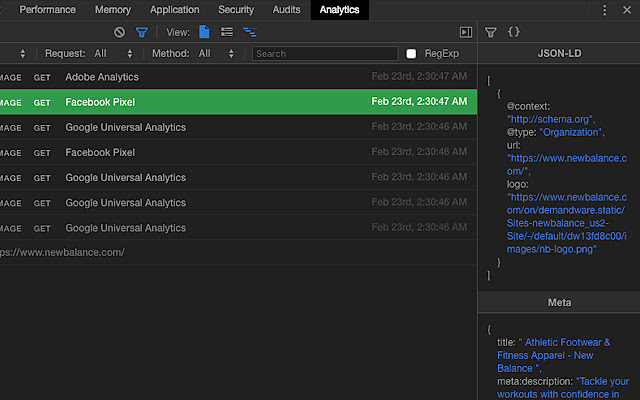
Analytics Debug Panel is an Open Source browser extension to inspect, search & filter analytics traffic in your Developer Console.
Analytics Debug Panelとは何ですか?
Analytics Debug Panelはhttps://redvanworkshop.comによって開発されたChromeの拡張機能で、その主な機能は「Analytics Debug Panel is an Open Source browser extension to inspect, search & filter analytics traffic in your Developer Console.」です。
拡張機能のスクリーンショット

Analytics Debug Panel拡張機能のCRXファイルをダウンロード
Analytics Debug Panel拡張子のファイルをcrx形式でダウンロードし、ブラウザにChrome拡張機能を手動でインストールするか、crxファイルを友達と共有して簡単にChrome拡張機能をインストールします。
拡張機能の使用方法
                        Red Van Workshop works with online retailers that have a variety of Analytic Providers for their differing business needs.  Working on new integrations and debugging existing ones is an integral part of our developer process.  We built this Browser Extension to help make that process easier.  We hope you will find it as useful as we do, and if you want to help make it better, we'd love to hear from you.

FEATURES:

• 100% Open Source
• Support for Chrome, Firefox & Opera
• Works with Adobe, Google & Facebook Analytics
• Copy Requests to Clipboard
• Light & Dark Themes
拡張機能の基本情報
| 名前 |  Analytics Debug Panel Analytics Debug Panel |
| ID | poaajdjaghjhnampllfkclmepngmaekb |
| 公式URL | https://chrome.google.com/webstore/detail/analytics-debug-panel/poaajdjaghjhnampllfkclmepngmaekb |
| 説明 | Analytics Debug Panel is an Open Source browser extension to inspect, search & filter analytics traffic in your Developer Console. |
| ファイルサイズ | 710 KB |
| インストール数 | 139 |
| 現在のバージョン | 1.0.0 |
| 最終更新日 | 2019-02-28 |
| 公開日 | 2019-02-23 |
| 評価 | 5.00/5 合計 1 レビュー |
| 開発者 | https://redvanworkshop.com |
| Eメール | [email protected] |
| 支払い方法 | free |
| 拡張機能のウェブサイト | https://github.com/redvanworkshop/analytics-debug-panel |
| ヘルプページのURL | https://github.com/redvanworkshop/analytics-debug-panel/issues |
| 対応言語 | en |
| manifest.json | |
{
    "update_url": "https:\/\/clients2.google.com\/service\/update2\/crx",
    "name": "Analytics Debug Panel",
    "version": "1.0.0",
    "description": "Analytics Debug Panel is an Open Source browser extension to inspect, search & filter analytics traffic in your Developer Console.",
    "author": "Peter Schmalfeldt",
    "manifest_version": 2,
    "icons": {
        "16": "icons\/16.png",
        "48": "icons\/48.png",
        "128": "icons\/128.png"
    },
    "permissions": [
        "http:\/\/*\/*",
        "https:\/\/*\/*",
        "storage",
        "tabs",
        "webNavigation",
        "webRequest",
        "webRequestBlocking"
    ],
    "browser_action": {
        "default_icon": "icons\/128.png",
        "default_title": "Analytics Debugger"
    },
    "background": {
        "page": "pages\/background.html"
    },
    "devtools_page": "pages\/devtools.html",
    "content_security_policy": "script-src 'self' 'unsafe-eval'; object-src 'self'",
    "web_accessible_resources": [
        "panel.html",
        "js\/vendor.js",
        "js\/manifest.js",
        "js\/browser-polyfill.js"
    ]
} | |