UDO Debugger
Extension to debug Tealium
Wat is UDO Debugger?
UDO Debugger is een Chrome-extensie ontwikkeld door https://www.thyngster.com, en de belangrijkste functie is "Extension to debug Tealium".
Extensie Screenshots


Download het CRX-bestand van de extensie UDO Debugger
Download UDO Debugger-extensiebestanden in crx-indeling, installeer Chrome-extensies handmatig in de browser of deel de crx-bestanden met vrienden om Chrome-extensies eenvoudig te installeren.
Instructies voor het Gebruik van de Extensie
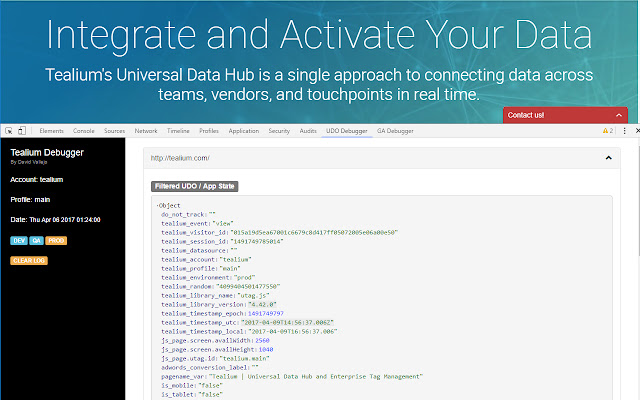
                        This Chrome Extension will allow you to debug your Tealium setup. Easing the task of vieweing the current UDO data, and utag.link calls.

New in Version 0.3.1
Removed unused permissions.

New in Version 0.3.0
- Tags List now show the state, Wait, Load, Send
- Tags List now show the latest tag update date
- Now all available tags are reported, only loaded are shown
- Total UTAG variables, links, views, tags reported on top of pages
- window.utag_data is reported on page load.

Fixes
- Improved Tealium IQ detection routines, to being able to catch all calls
- Fixed Enviroment Switcher on URLs with hashtags
- Copy to clipboard fixed now it works without needing a double click
- Lots of more small stuff =)

New in Version 0.2.2
Enviroment Switcher needs cookie access for the main_frame. Permissions restored. Tested with a wrong manifest on 0.2.1 version ;/

New in Version 0.2.1
Fixed Permissions to be activeTab only

New in Version 0.2.0

NEW. App State, Utag.link, utag.view Reporting
NEW. The current fired tags are reported.
NEW. Clipboard Support.
NEW. Environments Switcher
NEW. Debug Enabler / Reporter

All details at: https://www.thyngster.com/udo-debugger-easiest-way-to-work-and-qa-tealium-implementations/


In the current version the extension is able to provide the following info:

* The account name
* The profile name
* The enviroment
* Filtered Page App State (not including internal Tealium's utag_data variables)
* View utag.link calls in real time
* Loaded tags overview (Beta)
* Keep a log of current navigation historial along with all Tealium related data.


Steps to use this extension:

1. Open the Chrome Developers Tool:
        Windows and Linux: Control-Shift-J (or F12 key)
        MacOs: Command-Option-J.
2. Click on the Tealium Debugger Tab
3. If it's necessary Refresh the current page.

Changelog:
0.1.3:
- Extension Name change due to trademark complaint
- Improved code, now it shows info faster
- Added compatibility for some specific implementation setup types
0.1.1:
- Bug fixes
- Added Fired Pixels Beta
0.1.0:
- First Public Version

* Disclaimer: This extension is not related in any way to Tealium company. It's sole product from an individual with any kind of relationship with the key company.
Basisinformatie over de Extensie
| Naam |  UDO Debugger UDO Debugger |
| ID | jkefkcljfkddbcgoepehkbolohkhjodi |
| Officiële URL | https://chrome.google.com/webstore/detail/udo-debugger/jkefkcljfkddbcgoepehkbolohkhjodi |
| Beschrijving | Extension to debug Tealium |
| Bestandsgrootte | 66.85 KB |
| Aantal Installaties | 2,986 |
| Huidige Versie | 0.4.0 |
| Laatst Bijgewerkt | 2023-04-17 |
| Publicatiedatum | 2020-06-30 |
| Beoordeling | 4.18/5 Totaal 11 Beoordelingen |
| Ontwikkelaar | https://www.thyngster.com |
| [email protected] | |
| Betalingswijze | free |
| Ondersteunde Talen | en |
| manifest.json | |
{
    "manifest_version": 3,
    "update_url": "https:\/\/clients2.google.com\/service\/update2\/crx",
    "name": "UDO Debugger",
    "version": "0.4.0",
    "icons": {
        "16": "images\/icon-16.png",
        "128": "images\/icon-128.png"
    },
    "devtools_page": "pages\/devtools.html",
    "description": "Extension to debug Tealium",
    "short_name": "udodebugger",
    "permissions": [],
    "author": "thyngster",
    "minimum_chrome_version": "88",
    "content_scripts": []
} | |