UDO Debugger
Extension to debug Tealium
O que é UDO Debugger?
UDO Debugger é uma extensão do Chrome desenvolvida por https://www.thyngster.com, e sua principal característica é "Extension to debug Tealium".
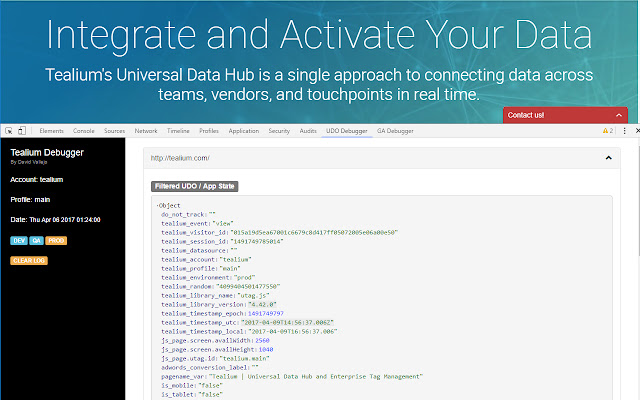
Capturas de Tela da Extensão


Baixar o arquivo CRX da Extensão UDO Debugger
Baixe arquivos de extensão UDO Debugger no formato crx, instale manualmente as extensões do Chrome no navegador ou compartilhe os arquivos crx com amigos para instalar facilmente as extensões do Chrome.
Instruções de Uso da Extensão
                        This Chrome Extension will allow you to debug your Tealium setup. Easing the task of vieweing the current UDO data, and utag.link calls.

New in Version 0.3.1
Removed unused permissions.

New in Version 0.3.0
- Tags List now show the state, Wait, Load, Send
- Tags List now show the latest tag update date
- Now all available tags are reported, only loaded are shown
- Total UTAG variables, links, views, tags reported on top of pages
- window.utag_data is reported on page load.

Fixes
- Improved Tealium IQ detection routines, to being able to catch all calls
- Fixed Enviroment Switcher on URLs with hashtags
- Copy to clipboard fixed now it works without needing a double click
- Lots of more small stuff =)

New in Version 0.2.2
Enviroment Switcher needs cookie access for the main_frame. Permissions restored. Tested with a wrong manifest on 0.2.1 version ;/

New in Version 0.2.1
Fixed Permissions to be activeTab only

New in Version 0.2.0

NEW. App State, Utag.link, utag.view Reporting
NEW. The current fired tags are reported.
NEW. Clipboard Support.
NEW. Environments Switcher
NEW. Debug Enabler / Reporter

All details at: https://www.thyngster.com/udo-debugger-easiest-way-to-work-and-qa-tealium-implementations/


In the current version the extension is able to provide the following info:

* The account name
* The profile name
* The enviroment
* Filtered Page App State (not including internal Tealium's utag_data variables)
* View utag.link calls in real time
* Loaded tags overview (Beta)
* Keep a log of current navigation historial along with all Tealium related data.


Steps to use this extension:

1. Open the Chrome Developers Tool:
        Windows and Linux: Control-Shift-J (or F12 key)
        MacOs: Command-Option-J.
2. Click on the Tealium Debugger Tab
3. If it's necessary Refresh the current page.

Changelog:
0.1.3:
- Extension Name change due to trademark complaint
- Improved code, now it shows info faster
- Added compatibility for some specific implementation setup types
0.1.1:
- Bug fixes
- Added Fired Pixels Beta
0.1.0:
- First Public Version

* Disclaimer: This extension is not related in any way to Tealium company. It's sole product from an individual with any kind of relationship with the key company.
Informações Básicas da Extensão
| Nome |  UDO Debugger UDO Debugger |
| ID | jkefkcljfkddbcgoepehkbolohkhjodi |
| URL Oficial | https://chrome.google.com/webstore/detail/udo-debugger/jkefkcljfkddbcgoepehkbolohkhjodi |
| Descrição | Extension to debug Tealium |
| Tamanho do Arquivo | 66.85 KB |
| Contagem de Instalações | 2,986 |
| Versão Atual | 0.4.0 |
| Última Atualização | 2023-04-17 |
| Data de Publicação | 2020-06-30 |
| Classificação | 4.18/5 Total de 11 Avaliações |
| Desenvolvedor | https://www.thyngster.com |
| [email protected] | |
| Tipo de Pagamento | free |
| Idiomas Suportados | en |
| manifest.json | |
{
    "manifest_version": 3,
    "update_url": "https:\/\/clients2.google.com\/service\/update2\/crx",
    "name": "UDO Debugger",
    "version": "0.4.0",
    "icons": {
        "16": "images\/icon-16.png",
        "128": "images\/icon-128.png"
    },
    "devtools_page": "pages\/devtools.html",
    "description": "Extension to debug Tealium",
    "short_name": "udodebugger",
    "permissions": [],
    "author": "thyngster",
    "minimum_chrome_version": "88",
    "content_scripts": []
} | |