Stock Chart v2
Stock Chart provide Technical Charts Analysis for forecasting stock, index of future price. Stock Chart 提供技術圖表分析工具,協助用家以估計股票或指數未來趨勢。
O que é Stock Chart v2?
Stock Chart v2 é uma extensão do Chrome desenvolvida por lok960821, e sua principal característica é "Stock Chart provide Technical Charts Analysis for forecasting stock, index of future price. Stock Chart 提供技術圖表分析工具,協助用家以估計股票或指數未來趨勢。".
Capturas de Tela da Extensão

Baixar o arquivo CRX da Extensão Stock Chart v2
Baixe arquivos de extensão Stock Chart v2 no formato crx, instale manualmente as extensões do Chrome no navegador ou compartilhe os arquivos crx com amigos para instalar facilmente as extensões do Chrome.
Instruções de Uso da Extensão
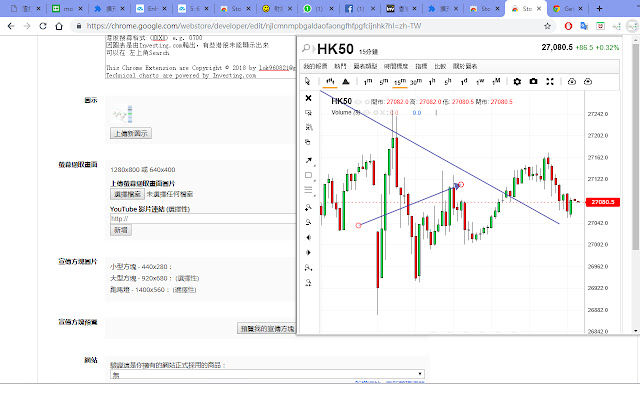
互動圖表
Stock Chart provide Technical Charts Analysis for forecasting stock, index of future price. Stock Chart 提供技術圖表分析工具,協助用家以估計股票或指數未來趨勢。
Real time Stock/Future/Index Technical Charts Analysis.
即時股票/期貨/指數的技術圖表分析工具
Function:
Drawing Tools
Real time price
Take Photo for your Chart
News of the Stock
功能:
畫圖工具
即時價位
輸出畫圖後的圖表
股票新聞
即月期 代號 HK50
HSI 代號 HONG KONG:HK50
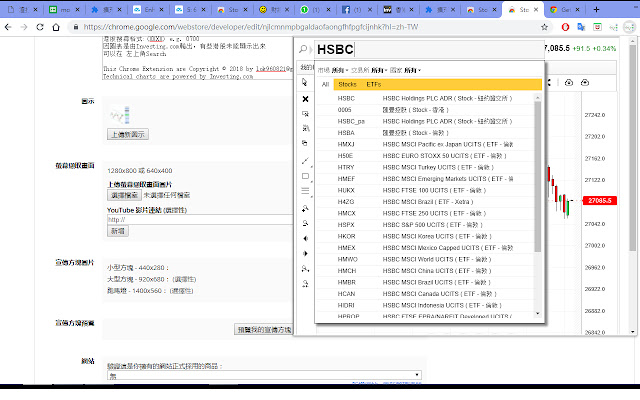
港股搜尋格式:(XXXX) e.g. 0700
因圖表是由Investing.com輸出,有些港股未能顯示出來
可以在 左上角Search
This Chrome Extension are Copyright © 2018 by [email protected]
Technical charts are powered by Investing.com Informações Básicas da Extensão
| Nome |  Stock Chart v2 Stock Chart v2 |
| ID | njlcmnmpbgaldaofaongfhfpgfcijnhk |
| URL Oficial | https://chrome.google.com/webstore/detail/njlcmnmpbgaldaofaongfhfpgfcijnhk |
| Descrição | Stock Chart provide Technical Charts Analysis for forecasting stock, index of future price. Stock Chart 提供技術圖表分析工具,協助用家以估計股票或指數未來趨勢。 |
| Tamanho do Arquivo | 422 KB |
| Contagem de Instalações | 282 |
| Versão Atual | 1.0 |
| Última Atualização | 2018-10-03 |
| Data de Publicação | 2018-10-03 |
| Classificação | 5.00/5 Total de 1 Avaliações |
| Desenvolvedor | lok960821 |
| Tipo de Pagamento | free |
| Idiomas Suportados | zh-TW |
| manifest.json | |
{
    "update_url": "https:\/\/clients2.google.com\/service\/update2\/crx",
    "name": "Stock Chart v2",
    "version": "1.0",
    "description": "Stock Chart provide Technical Charts Analysis for forecasting stock, index of future price. Stock Chart \u63d0\u4f9b\u6280\u8853\u5716\u8868\u5206\u6790\u5de5\u5177\uff0c\u5354\u52a9\u7528\u5bb6\u4ee5\u4f30\u8a08\u80a1\u7968\u6216\u6307\u6578\u672a\u4f86\u8da8\u52e2\u3002",
    "browser_action": {
        "default_popup": "popup.html"
    },
    "icons": {
        "16": "get_started16.png",
        "32": "get_started32.png",
        "48": "get_started48.png",
        "128": "get_started128.png"
    },
    "manifest_version": 2
} | |