Analytics Debug Panel
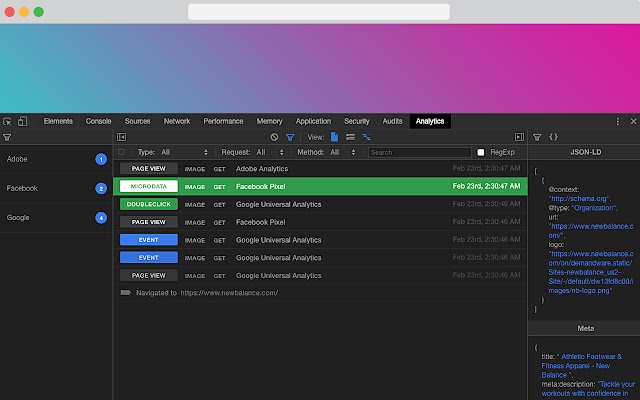
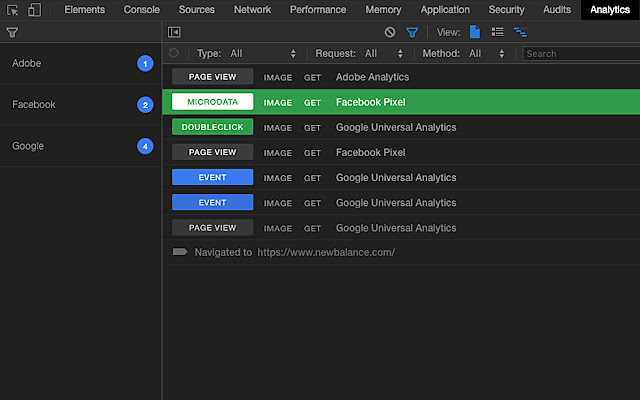
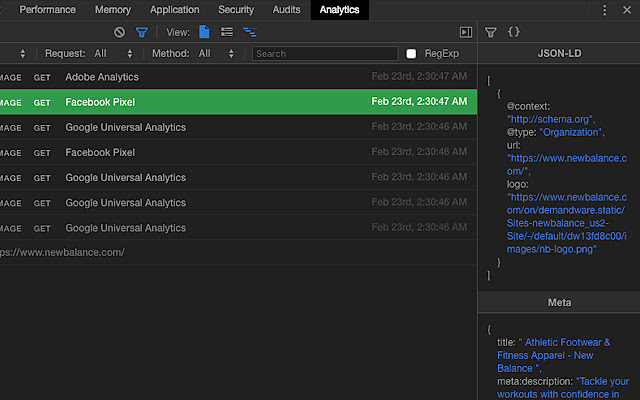
Analytics Debug Panel is an Open Source browser extension to inspect, search & filter analytics traffic in your Developer Console.
Analytics Debug Panelคืออะไร?
Analytics Debug Panel เป็นส่วนขยายของ Chrome ที่พัฒนาโดย https://redvanworkshop.com และคุณลักษณะหลักของมันคือ "Analytics Debug Panel is an Open Source browser extension to inspect, search & filter analytics traffic in your Developer Console."
ภาพหน้าจอของส่วนขยาย

ดาวน์โหลดไฟล์ CRX ของส่วนขยาย Analytics Debug Panel
ดาวน์โหลดไฟล์ส่วนขยาย Analytics Debug Panel ในรูปแบบ crx และติดตั้งส่วนขยาย Chrome ด้วยตนเองในเบราว์เซอร์หรือแชร์ไฟล์ crx กับเพื่อนๆ เพื่อติดตั้งส่วนขยาย Chrome อย่างง่ายดาย
คำแนะนำในการใช้ส่วนขยาย
                        Red Van Workshop works with online retailers that have a variety of Analytic Providers for their differing business needs.  Working on new integrations and debugging existing ones is an integral part of our developer process.  We built this Browser Extension to help make that process easier.  We hope you will find it as useful as we do, and if you want to help make it better, we'd love to hear from you.

FEATURES:

• 100% Open Source
• Support for Chrome, Firefox & Opera
• Works with Adobe, Google & Facebook Analytics
• Copy Requests to Clipboard
• Light & Dark Themes
ข้อมูลพื้นฐานของส่วนขยาย
| ชื่อ |  Analytics Debug Panel Analytics Debug Panel |
| ID | poaajdjaghjhnampllfkclmepngmaekb |
| URL อย่างเป็นทางการ | https://chrome.google.com/webstore/detail/analytics-debug-panel/poaajdjaghjhnampllfkclmepngmaekb |
| คำอธิบาย | Analytics Debug Panel is an Open Source browser extension to inspect, search & filter analytics traffic in your Developer Console. |
| ขนาดไฟล์ | 710 KB |
| จำนวนการติดตั้ง | 139 |
| เวอร์ชันปัจจุบัน | 1.0.0 |
| อัปเดตครั้งล่าสุด | 2019-02-28 |
| วันที่เผยแพร่ | 2019-02-23 |
| คะแนน | 5.00/5 รวมทั้งหมด 1 คะแนน |
| ผู้พัฒนา | https://redvanworkshop.com |
| อีเมล | [email protected] |
| ประเภทการชำระเงิน | free |
| เว็บไซต์ส่วนขยาย | https://github.com/redvanworkshop/analytics-debug-panel |
| URL หน้าช่วยเหลือ | https://github.com/redvanworkshop/analytics-debug-panel/issues |
| ภาษาที่รองรับ | en |
| manifest.json | |
{
    "update_url": "https:\/\/clients2.google.com\/service\/update2\/crx",
    "name": "Analytics Debug Panel",
    "version": "1.0.0",
    "description": "Analytics Debug Panel is an Open Source browser extension to inspect, search & filter analytics traffic in your Developer Console.",
    "author": "Peter Schmalfeldt",
    "manifest_version": 2,
    "icons": {
        "16": "icons\/16.png",
        "48": "icons\/48.png",
        "128": "icons\/128.png"
    },
    "permissions": [
        "http:\/\/*\/*",
        "https:\/\/*\/*",
        "storage",
        "tabs",
        "webNavigation",
        "webRequest",
        "webRequestBlocking"
    ],
    "browser_action": {
        "default_icon": "icons\/128.png",
        "default_title": "Analytics Debugger"
    },
    "background": {
        "page": "pages\/background.html"
    },
    "devtools_page": "pages\/devtools.html",
    "content_security_policy": "script-src 'self' 'unsafe-eval'; object-src 'self'",
    "web_accessible_resources": [
        "panel.html",
        "js\/vendor.js",
        "js\/manifest.js",
        "js\/browser-polyfill.js"
    ]
} | |