UDO Debugger
Extension to debug Tealium
什么是UDO Debugger?
UDO Debugger是由https://www.thyngster.com开发的Chrome扩展程序,该扩展的主要功能是“Extension to debug Tealium”。
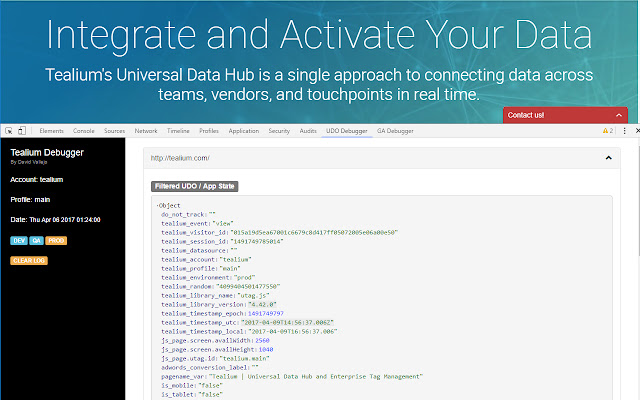
扩展截图


下载UDO Debugger扩展crx文件
下载UDO Debugger扩展crx格式的文件,手动将Chrome插件安装到浏览器中,也可以将crx文件分享给朋友,轻松安装Chrome插件。
扩展使用说明
                        This Chrome Extension will allow you to debug your Tealium setup. Easing the task of vieweing the current UDO data, and utag.link calls.

New in Version 0.3.1
Removed unused permissions.

New in Version 0.3.0
- Tags List now show the state, Wait, Load, Send
- Tags List now show the latest tag update date
- Now all available tags are reported, only loaded are shown
- Total UTAG variables, links, views, tags reported on top of pages
- window.utag_data is reported on page load.

Fixes
- Improved Tealium IQ detection routines, to being able to catch all calls
- Fixed Enviroment Switcher on URLs with hashtags
- Copy to clipboard fixed now it works without needing a double click
- Lots of more small stuff =)

New in Version 0.2.2
Enviroment Switcher needs cookie access for the main_frame. Permissions restored. Tested with a wrong manifest on 0.2.1 version ;/

New in Version 0.2.1
Fixed Permissions to be activeTab only

New in Version 0.2.0

NEW. App State, Utag.link, utag.view Reporting
NEW. The current fired tags are reported.
NEW. Clipboard Support.
NEW. Environments Switcher
NEW. Debug Enabler / Reporter

All details at: https://www.thyngster.com/udo-debugger-easiest-way-to-work-and-qa-tealium-implementations/


In the current version the extension is able to provide the following info:

* The account name
* The profile name
* The enviroment
* Filtered Page App State (not including internal Tealium's utag_data variables)
* View utag.link calls in real time
* Loaded tags overview (Beta)
* Keep a log of current navigation historial along with all Tealium related data.


Steps to use this extension:

1. Open the Chrome Developers Tool:
        Windows and Linux: Control-Shift-J (or F12 key)
        MacOs: Command-Option-J.
2. Click on the Tealium Debugger Tab
3. If it's necessary Refresh the current page.

Changelog:
0.1.3:
- Extension Name change due to trademark complaint
- Improved code, now it shows info faster
- Added compatibility for some specific implementation setup types
0.1.1:
- Bug fixes
- Added Fired Pixels Beta
0.1.0:
- First Public Version

* Disclaimer: This extension is not related in any way to Tealium company. It's sole product from an individual with any kind of relationship with the key company.
扩展基本信息
| 名称 |  UDO Debugger UDO Debugger |
| ID | jkefkcljfkddbcgoepehkbolohkhjodi |
| 官方URL | https://chrome.google.com/webstore/detail/udo-debugger/jkefkcljfkddbcgoepehkbolohkhjodi |
| 简介 | Extension to debug Tealium |
| 文件大小 | 66.85 KB |
| 安装次数 | 2,986 |
| 当前版本 | 0.4.0 |
| 更新时间 | 2023-04-17 |
| 上架时间 | 2020-06-30 |
| 评分 | 4.18/5 共11次评分 |
| 开发者 | https://www.thyngster.com |
| 电子邮箱 | [email protected] |
| 付费类型 | free |
| 支持的语言 | en |
| manifest.json | |
{
    "manifest_version": 3,
    "update_url": "https:\/\/clients2.google.com\/service\/update2\/crx",
    "name": "UDO Debugger",
    "version": "0.4.0",
    "icons": {
        "16": "images\/icon-16.png",
        "128": "images\/icon-128.png"
    },
    "devtools_page": "pages\/devtools.html",
    "description": "Extension to debug Tealium",
    "short_name": "udodebugger",
    "permissions": [],
    "author": "thyngster",
    "minimum_chrome_version": "88",
    "content_scripts": []
} | |