Analytics Debug Panel
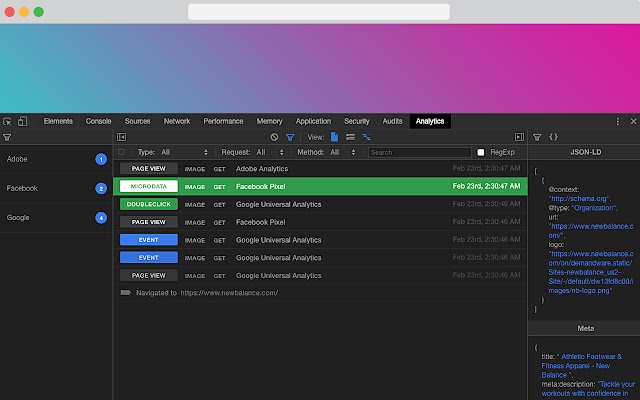
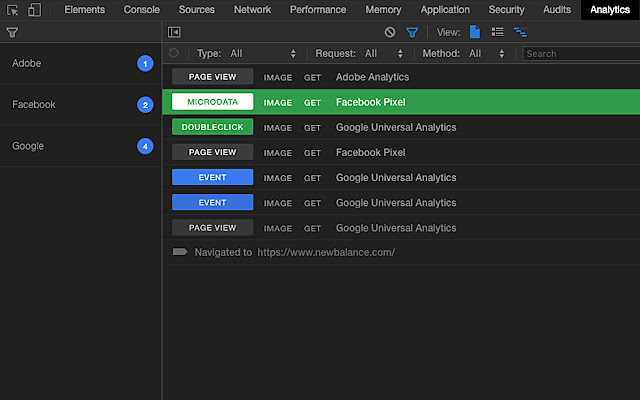
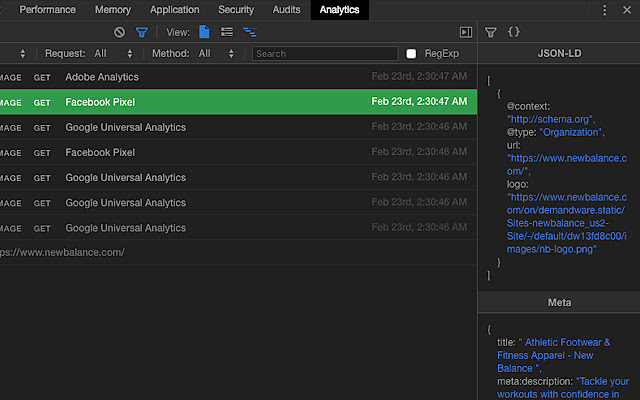
Analytics Debug Panel is an Open Source browser extension to inspect, search & filter analytics traffic in your Developer Console.
什么是Analytics Debug Panel?
Analytics Debug Panel是由https://redvanworkshop.com开发的Chrome扩展程序,该扩展的主要功能是“Analytics Debug Panel is an Open Source browser extension to inspect, search & filter analytics traffic in your Developer Console.”。
扩展截图

下载Analytics Debug Panel扩展crx文件
下载Analytics Debug Panel扩展crx格式的文件,手动将Chrome插件安装到浏览器中,也可以将crx文件分享给朋友,轻松安装Chrome插件。
扩展使用说明
                        Red Van Workshop works with online retailers that have a variety of Analytic Providers for their differing business needs.  Working on new integrations and debugging existing ones is an integral part of our developer process.  We built this Browser Extension to help make that process easier.  We hope you will find it as useful as we do, and if you want to help make it better, we'd love to hear from you.

FEATURES:

• 100% Open Source
• Support for Chrome, Firefox & Opera
• Works with Adobe, Google & Facebook Analytics
• Copy Requests to Clipboard
• Light & Dark Themes
扩展基本信息
| 名称 |  Analytics Debug Panel Analytics Debug Panel |
| ID | poaajdjaghjhnampllfkclmepngmaekb |
| 官方URL | https://chrome.google.com/webstore/detail/analytics-debug-panel/poaajdjaghjhnampllfkclmepngmaekb |
| 简介 | Analytics Debug Panel is an Open Source browser extension to inspect, search & filter analytics traffic in your Developer Console. |
| 文件大小 | 710 KB |
| 安装次数 | 139 |
| 当前版本 | 1.0.0 |
| 更新时间 | 2019-02-28 |
| 上架时间 | 2019-02-23 |
| 评分 | 5.00/5 共1次评分 |
| 开发者 | https://redvanworkshop.com |
| 电子邮箱 | [email protected] |
| 付费类型 | free |
| 扩展官网 | https://github.com/redvanworkshop/analytics-debug-panel |
| 帮助页面URL | https://github.com/redvanworkshop/analytics-debug-panel/issues |
| 支持的语言 | en |
| manifest.json | |
{
    "update_url": "https:\/\/clients2.google.com\/service\/update2\/crx",
    "name": "Analytics Debug Panel",
    "version": "1.0.0",
    "description": "Analytics Debug Panel is an Open Source browser extension to inspect, search & filter analytics traffic in your Developer Console.",
    "author": "Peter Schmalfeldt",
    "manifest_version": 2,
    "icons": {
        "16": "icons\/16.png",
        "48": "icons\/48.png",
        "128": "icons\/128.png"
    },
    "permissions": [
        "http:\/\/*\/*",
        "https:\/\/*\/*",
        "storage",
        "tabs",
        "webNavigation",
        "webRequest",
        "webRequestBlocking"
    ],
    "browser_action": {
        "default_icon": "icons\/128.png",
        "default_title": "Analytics Debugger"
    },
    "background": {
        "page": "pages\/background.html"
    },
    "devtools_page": "pages\/devtools.html",
    "content_security_policy": "script-src 'self' 'unsafe-eval'; object-src 'self'",
    "web_accessible_resources": [
        "panel.html",
        "js\/vendor.js",
        "js\/manifest.js",
        "js\/browser-polyfill.js"
    ]
} | |